America's Roads & Bridges - Key Facts
by Larry Lagarde
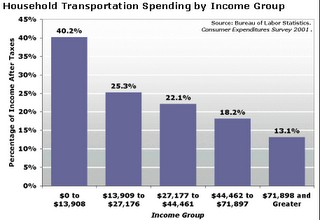
 Travel by motor vehicle is causing a growing crisis in the USA. Traffic congestion and poor road conditions continue to persist despite record spending on highways. In the process, transportation spending is dramatically & unfairly consuming the budgets of America's poor.
According to TRIP, a nonprofit organization that promotes the construction of roadways and bridges, the following roadway statistics were assembled from data compiled by the Federal Highway Administration, the Bureau of Transportation Statistics, the National Highway Traffic Safety Administration and the Texas Transportation Institute. Many of the facts listed below were used by Congress as talking points to pass SAFETEA-LU.
Key Facts About America's Road & Bridge Conditions
* Poor roadway conditions cost U.S. motorists $54 billion/year in extra vehicle repairs and operating costs - $275/motorist.
* Traffic congestion costs American motorists over $63 billion/year in time lost and fuel costs.
* Americans spend over 3.5 billion hours/year stuck in traffic.
* Motor vehicle crashes cost U.S. citizens $230 billion/year for medical expenses, lost productivity, travel delays, workplace costs, insurance costs and legal costs - $819/citizen.
* 34% of America's major roads are in poor or mediocre condition.
* 27% of America's bridges are structurally deficient or functionally obsolete.
* 36% of America's major urban roads are congested.
* 88% of all person miles of travel comes from private motor vehicles (just 8% comes from air travel & 1% from mass transit).
* Vehicle travel on America's highways increased 161% from 1970 to 2003 (while US population grew by 43% & new road mileage grew 6%).
 An Unsustainable Model
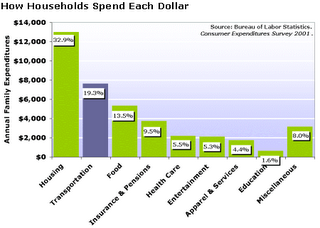
Suburban sprawl is sapping America's strength. In 2001, it was estimated that roughly 20% of average American household spending was going to transportation. Since then, increases in the cost of fuel have significantly increased American transportation costs, further pinching the ability of the poor to meet their daily needs.
Somehow, more funding must be dedicated to improving maintenance of existing roadways, improving alternative transportation options and rebuilding urban America. Otherwise, future man-made catastrophes such as the I-35W bridge collapse are bound to be repeated.
Labels: I35W-disaster, USA-road-bridge-facts


